
CDC says, Sugar-sweetened beverages (SSBs) or sugary drinks are leading sources of added sugars in the American diet. Frequently drinking sugar-sweetened beverages is associated with weight gain/obesity, type 2 diabetes, heart disease, kidney diseases, non-alcoholic liver disease, tooth decay and cavities, and gout, a type of arthritis
According to NCHS data briefs, adults and adolescents who smoke, don’t get enough sleep, don’t exercise much, eat fast food often and who do not eat fruit regularly are more likely to be frequent consumers of SSBs. Additionally, adolescents who frequently drink SSBs also have more screen time (e.g., television, cell phones, computers, video games). In 2011-2014, 6 in 10 youth (63%) and 5 in 10 adults (49%) drank a sugar-sweetened beverage on a given day. On average, U.S. youth consume 143 calories from SSBs and U.S. adults consume 145 calories from SSBs on a given day. Americans drink 52% of SSB calories at home and 48% of SSB calories away from home.
The below map by BRFSS shows the prevalence distribution of daily sugar-sweetened beverage intakes in 2013.
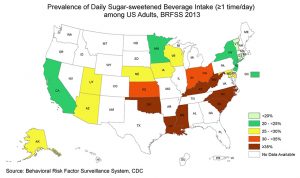
Few findings from the map are:
- In only 2 states out of 23 states and DC surveyed, less than 20% of adults were daily SSB consumers.
- In 4 states and DC out of 23 states and DC surveyed, 20% to less than 25% of adults were daily SSB consumers.
- In 7 states out of 23 states and DC surveyed, 25% to less than 30% of adults were daily SSB consumers.
- In 3 states out of 23 states and DC surveyed, 30% to less than 35% of adults were daily SSB consumers.
- In 7 states out of 23 states and DC surveyed, 35% or more of adults were daily SSB consumers.